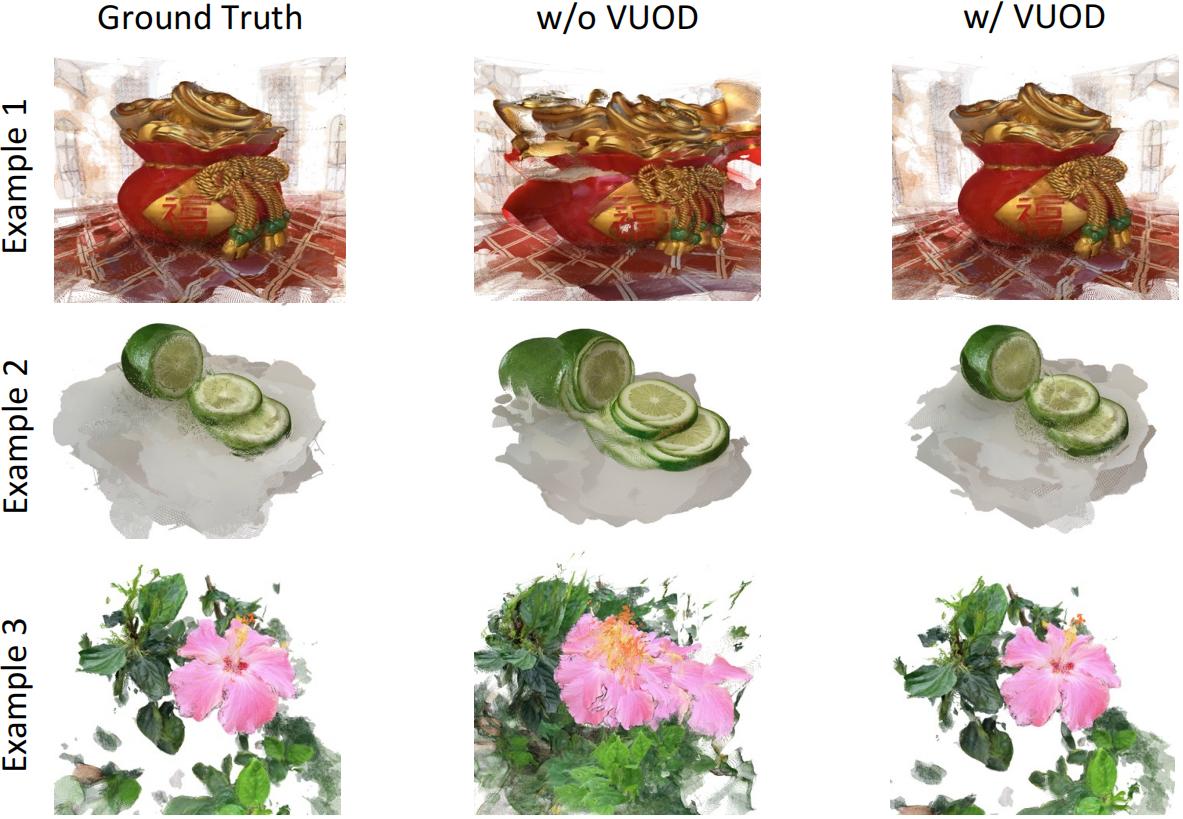
Teaser
‡ Work done during an internship at SmartMore.
✉ Corresponding author: jiangbo.lu@gmail.com
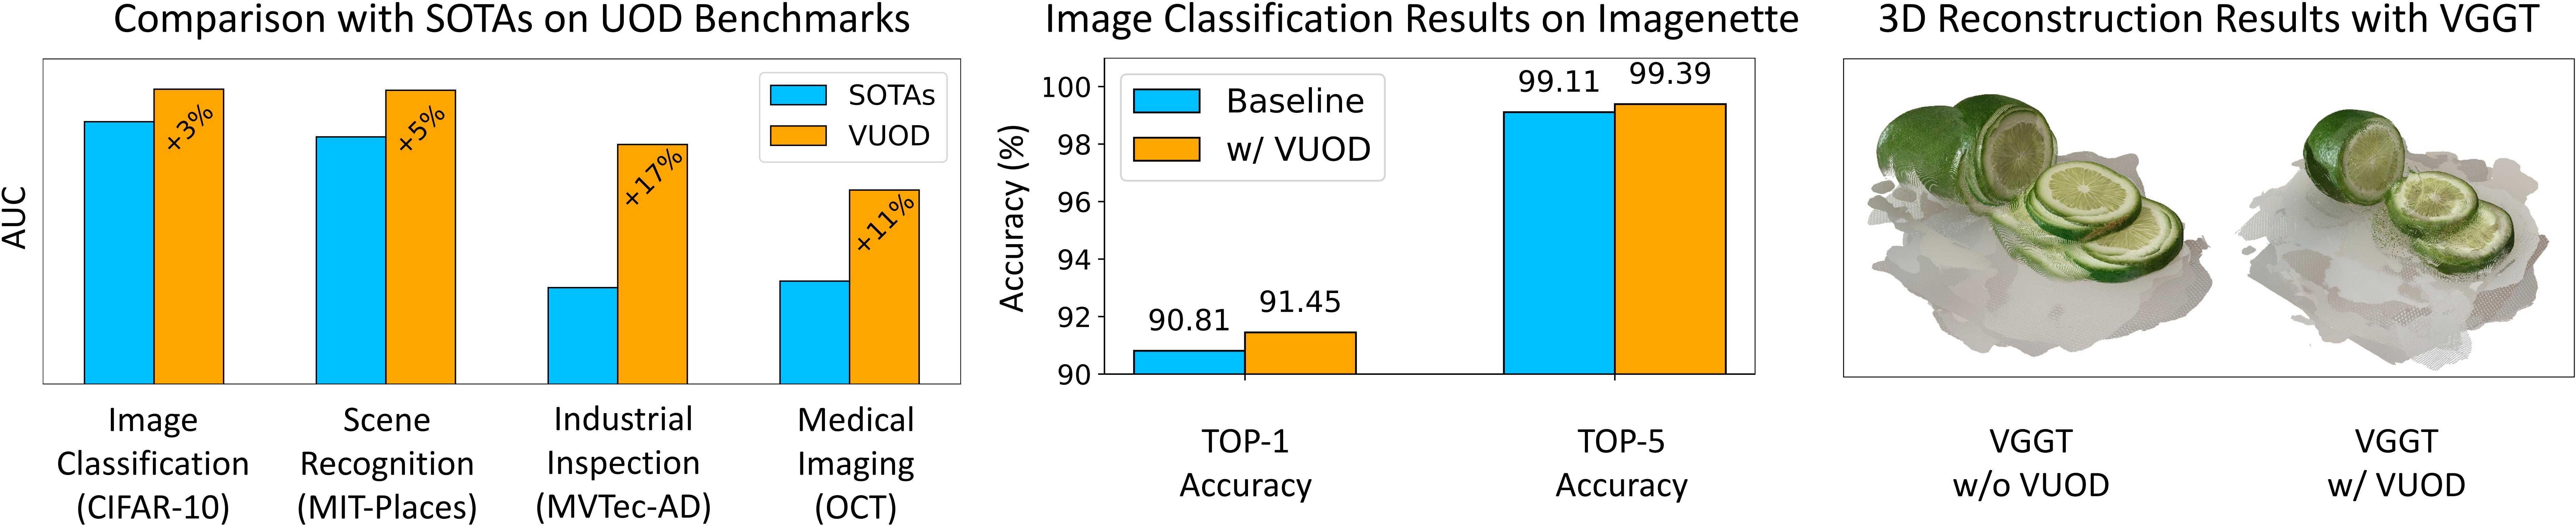
Unsupervised outlier detection that automatically identifies whether visual systems involve anomalous images is a significant research topic. However, most approaches are limited to natural images because they rely on frozen and pre-trained feature extractors. So that their performance cannot be maintained in practical scenarios, especially for industrial inspection and medical imaging. In this work, we first revisit this task and then introduce a versatile unsupervised outlier detection framework to enrich the application domains. The core idea of this framework is to improve feature discriminativeness via exploiting intrinsic distribution priors. Evaluated on 3 domains and 14 benchmark datasets, our proposed solution achieves state-of-the-art performance and significantly outperforms existing methods. More importantly, we show its plug-and-play property that can be integrated into diverse visual applications to improve their robustness, such as image classification and 3D reconstruction.
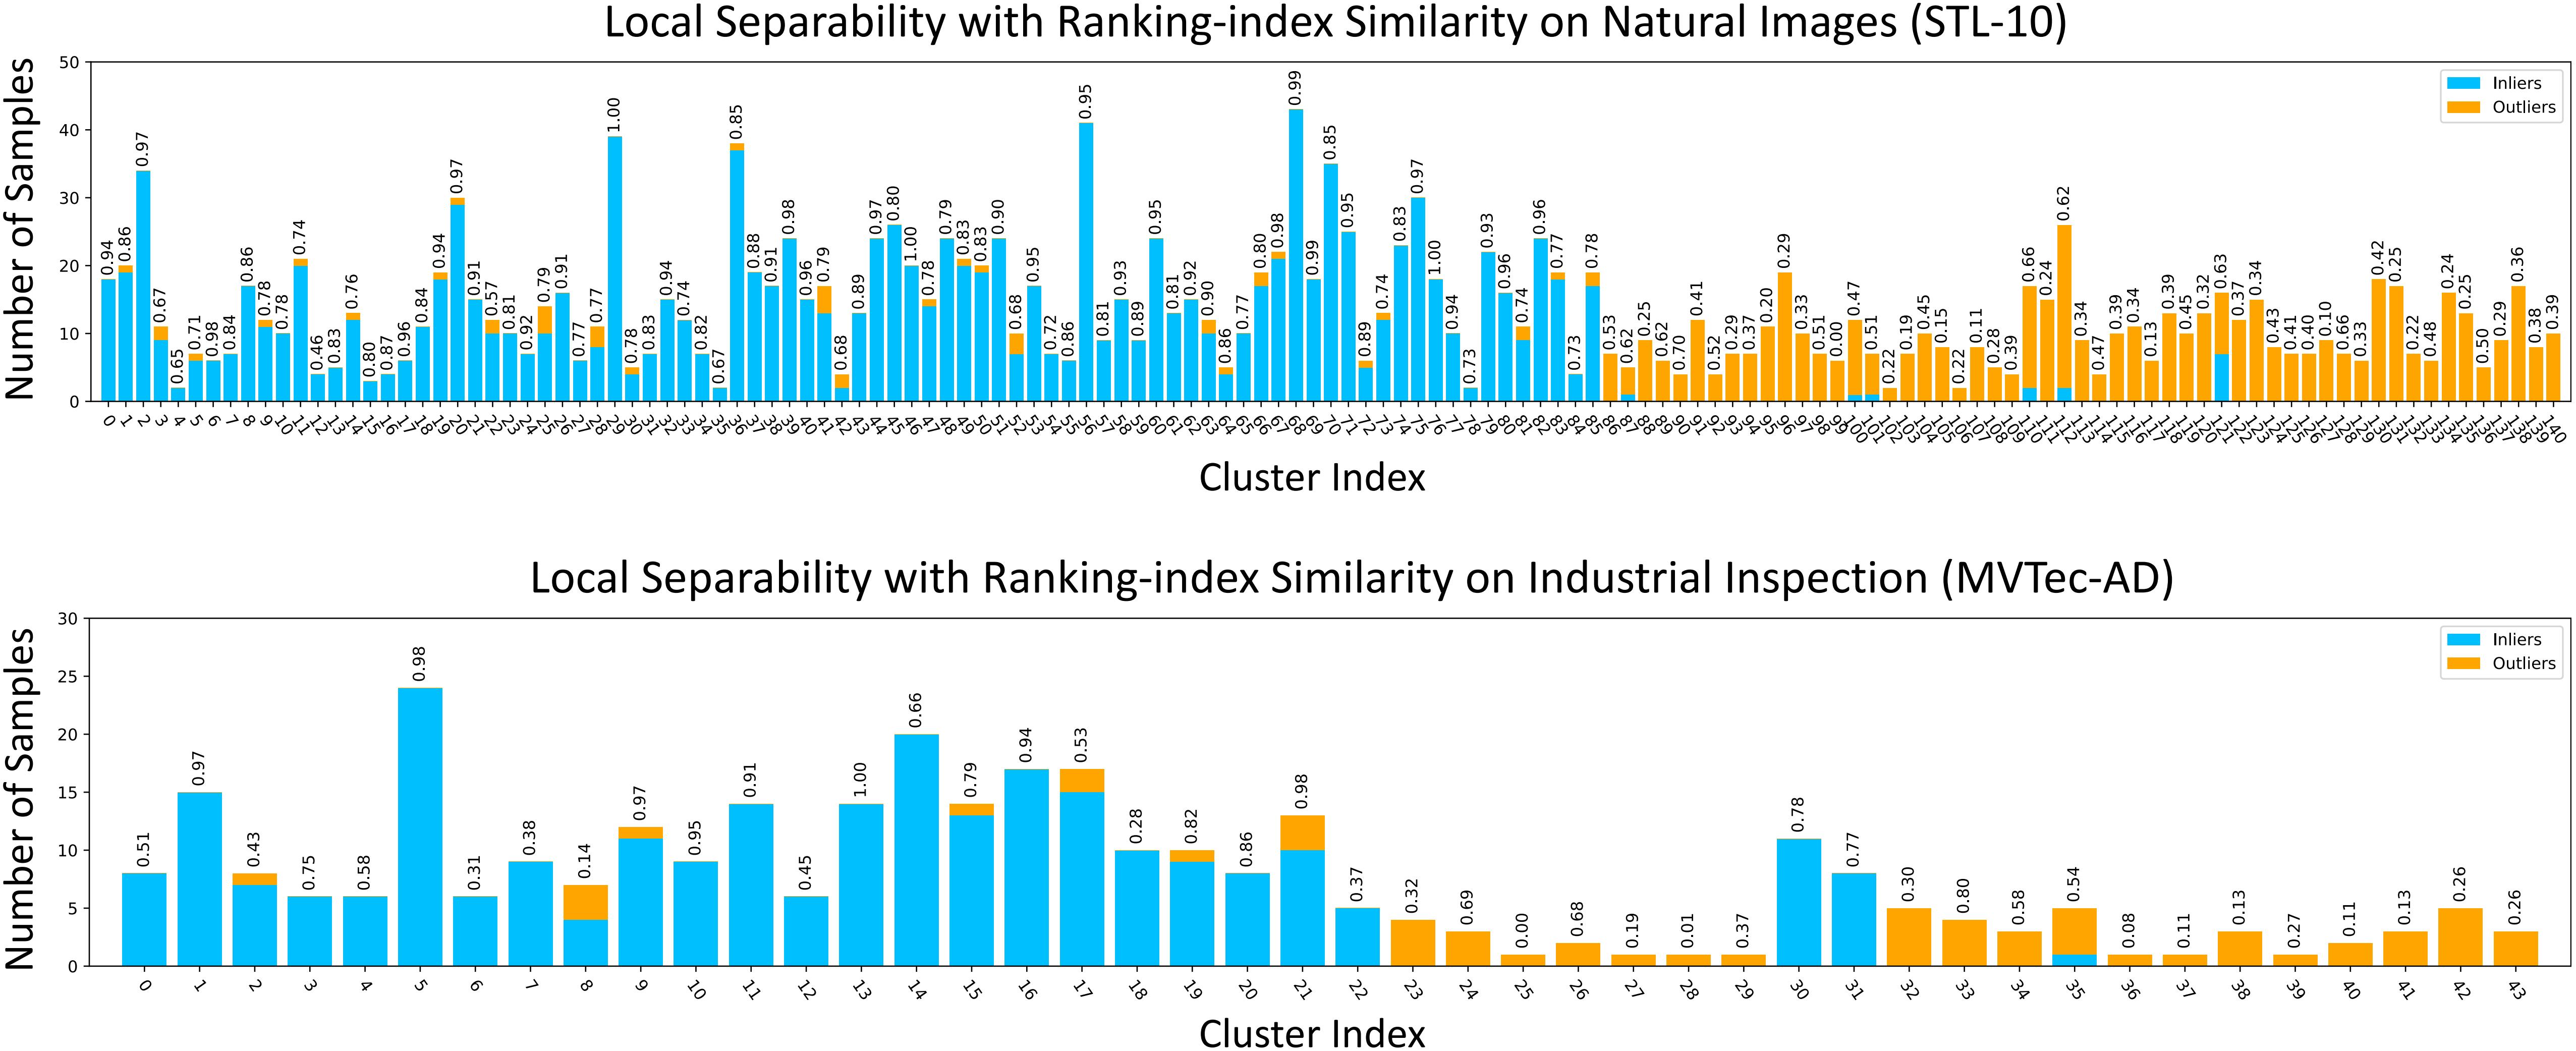
To apply UOD approaches into diverse domains, the core idea is to enhance the discriminativeness of feature representation via pseudo labeling (self-supervision generation) , i.e., splitting both inlier features and outlier features from features of the target dataset, and thereby leveraging contrastive learning strategy to enlarge the similarity within inliers and the difference between inliers and outliers in the enhanced feature space.
We adopt Affinity Propagation (AP)[1], which will split the target dataset's features into: inlier clusters that each cluster mostly contains inliers (high ranking-index similarity (often larger than 0.9)); outlier clusters that each cluster mostly contains outliers (low ranking-index similarity (often less than 0.5)); mixed clusters that contain both inliers and outliers.
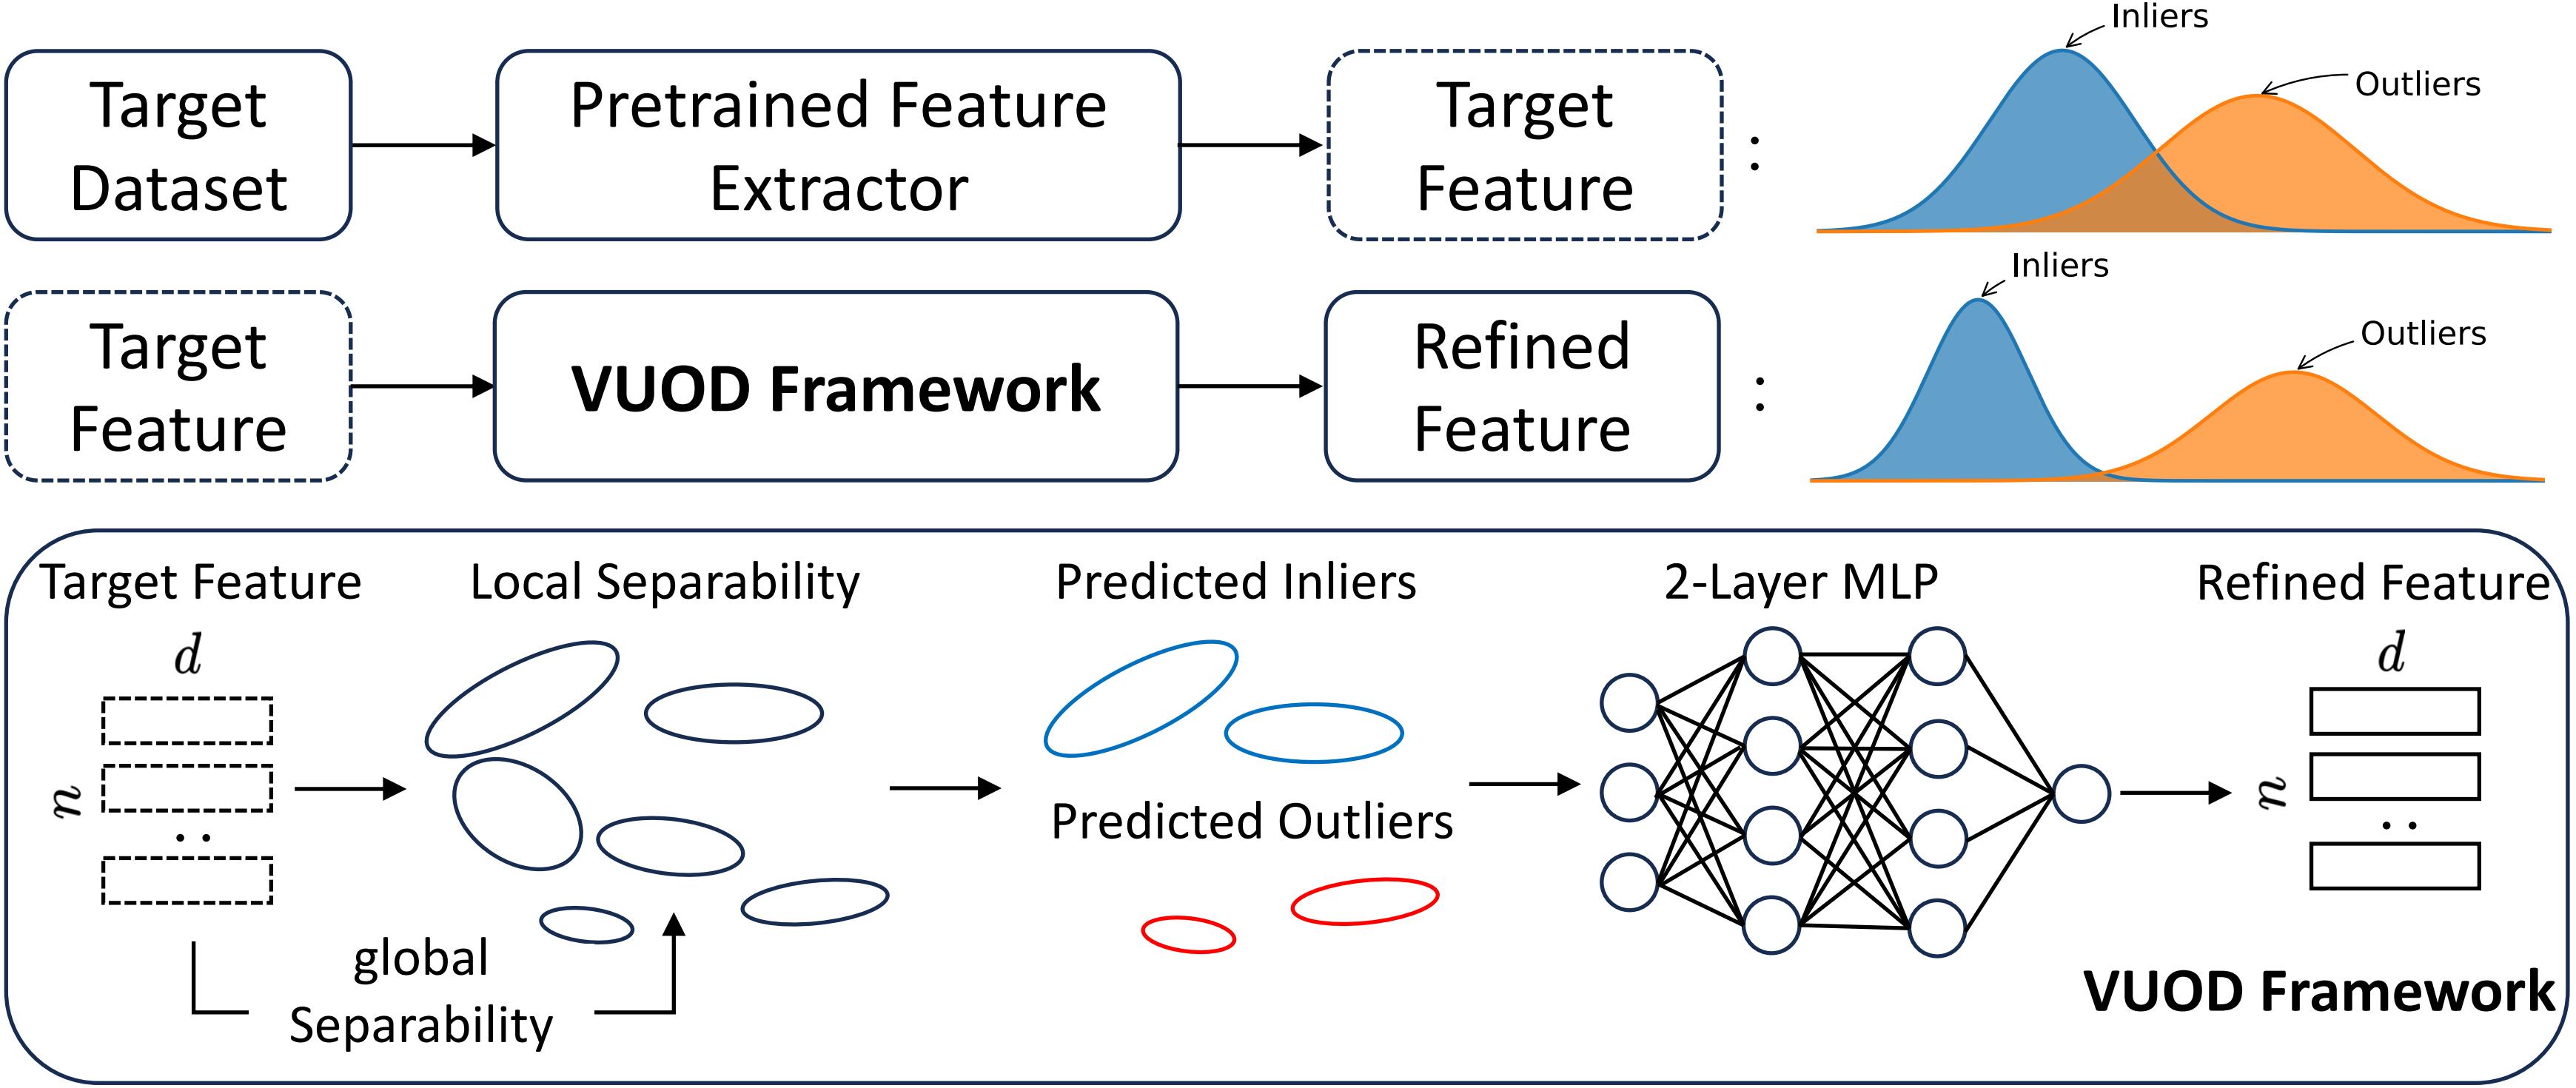
An unlabeled target dataset is first processed by natural image pretrained feature extractors. We then investigate the intrinsic priors of the feature space (local and global separability), and generate pseudo labels. Based on predicted inliers and outliers, we apply contrastive learning to enhance the discriminativeness of the feature representations.
| Method | Venue | STL-10 | Internet | Caltech-101 | CIFAR-10 | CIFAR-100 | MIT-Places |
|---|---|---|---|---|---|---|---|
| Deep SVDD | ICML-2018 | 0.593 | 0.674 | 0.745 | 0.533 | 0.575 | 0.539 |
| RSRAE | ICLR-2019 | 0.903 | 0.916 | 0.986 | 0.816 | 0.889 | 0.778 |
| GOAD | ICLR-2020 | 0.946 | 0.945 | 0.981 | 0.862 | 0.886 | 0.871 |
| Shell-Re | TPAMI-2021 | 0.866 | 0.896 | 0.905 | 0.867 | 0.834 | 0.822 |
| NeuTraL | ICML-2021 | 0.828 | 0.877 | 0.633 | 0.748 | 0.815 | 0.711 |
| ICL | ICLR-2022 | 0.929 | 0.937 | 0.964 | 0.859 | 0.911 | 0.832 |
| LUNAR | AAAI-2022 | 0.781 | 0.776 | 0.923 | 0.766 | 0.859 | 0.698 |
| ECOD | TKDE-2022 | 0.932 | 0.925 | 0.976 | 0.888 | 0.905 | 0.846 |
| LVAD | ECCV-2022 | 0.948 | 0.923 | 0.977 | 0.864 | 0.907 | 0.860 |
| SLAD | ICML-2023 | 0.923 | 0.919 | 0.888 | 0.861 | 0.899 | 0.846 |
| DeepIF | TKDE-2023 | 0.858 | 0.866 | 0.874 | 0.801 | 0.808 | 0.765 |
| Multi-T | ECCV-2024 | 0.957 | 0.956 | 0.985 | 0.888 | 0.917 | 0.859 |
| FlexUOD | CVPR-2025 | 0.980 | 0.981 | 0.983 | 0.942 | 0.947 | 0.928 |
| VUOD (Ours) | — | 0.994 | 0.991 | 0.994 | 0.972 | 0.981 | 0.971 |
| Type | Dataset | ResNet-18 | Wide ResNet-101 | ||||||||
|---|---|---|---|---|---|---|---|---|---|---|---|
| RSRAE | LVAD | Multi-T | FlexUOD | VUOD | RSRAE | LVAD | Multi-T | FlexUOD | VUOD | ||
| Industrial | MVTec-AD | 0.709 | 0.779 | 0.757 | 0.752 | 0.911 | 0.770 | 0.799 | 0.780 | 0.778 | 0.931 |
| BTAD | 0.873 | 0.894 | 0.885 | 0.882 | 0.902 | 0.846 | 0.884 | 0.886 | 0.883 | 0.928 | |
| MPDD | 0.618 | 0.573 | 0.563 | 0.564 | 0.906 | 0.592 | 0.602 | 0.603 | 0.595 | 0.926 | |
| MVTec-LOCO | 0.655 | 0.693 | 0.661 | 0.663 | 0.812 | 0.629 | 0.695 | 0.657 | 0.660 | 0.832 | |
| Medical | LiverCT | 0.666 | 0.663 | 0.696 | 0.708 | 0.813 | 0.703 | 0.571 | 0.652 | 0.567 | 0.838 |
| BrainMRI | 0.541 | 0.623 | 0.583 | 0.584 | 0.804 | 0.676 | 0.647 | 0.652 | 0.578 | 0.790 | |
| OCT | 0.524 | 0.778 | 0.730 | 0.612 | 0.880 | 0.713 | 0.811 | 0.725 | 0.588 | 0.877 | |
| RESC | 0.712 | 0.810 | 0.823 | 0.948 | 0.901 | 0.662 | 0.746 | 0.644 | 0.589 | 0.931 | |
We show its plug-and-play property across downstream vision pipelines: simply place VUOD as a data pre-filter before task-specific models.
Dataset -> VUOD filtering -> ResNet-18 training
Top-1: 90.81% -> 91.45% | Top-5: 99.11% -> 99.39%
VUOD removes noisy outliers before supervised optimization, improving robustness with minimal integration overhead.
Input sequence -> VUOD outlier rejection -> VGGT reconstruction
Per-image filtering latency: 118 ms -> 27 ms (4.4x speedup)
Compared with RobustVGGT[2]-style rejection, VUOD is backbone-agnostic and delivers faster, stable preprocessing.
| Method | Time(S.) | FLOPs(G) | GPU Mem(MB) |
|---|---|---|---|
| EfficientAD [3] | 42.1 | 75.9 | 102.0 |
| VUOD | 17.2 | 22.8 | 39.2 |
@article{liu2026vuod,
  author    = {Zhonghang Liu, Siyuan Chen, Jingwen Yu, Changshuo Wang, Kunyang Li, Jiangbo Lu},
  title     = {VUOD: A Versatile Unsupervised Outlier Detection Framework for Natural, Industrial, Medical Images and Beyond},
  journal   = {European Conference on Computer Vision},
  year      = {2026},
}